Used Books @99
Technical Analysis Explained: The Successful Investor's Guide to Spotting Investment Trends and Turning Points & Martin Pring's Introduction to Technical Analysis
Technical Analysis Explained: The Successful Investor's Guide to Spotting Investment Trends and Turning Points & Martin Pring's Introduction to Technical Analysis
Couldn't load pickup availability
TECHNICAL ANALYSIS EXPLAINED
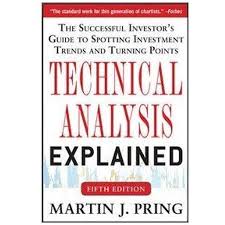
Technical Analysis Explained, Fifth Edition, is the updated bible of technical analysis written by a renowned expert and educational pioneer in the field. Widely recognized in the investment industry as the most authoritative guide on the subject, it gives you everything you need to forecast accurately how investors will respond to future events based on how they have statistically responded in the past. Martin Pring, described in Barron's as a ""technician's technician,"" uses his popular straight-talk style of instruction to help all types of investors forecast price movements with reliable accuracy. Through his concentrated blend of theory and techniques, generations of investors have become better traders and gained long-term wealth. Now, this new edition shows today's investors how to use the power of technical analysis in computerized markets with ever-changing investment products. This well-organized guide gets you started right away with: A step-by-step program for making technical analysis part of your investing routine Practical strategies for using today's most sophisticated investment tools and techniques An insider's look at the psychology of investors aimed at mastering your emotions Movement in stock prices, breaking business news and regularly issued financial reports all cause traders and investors to react-and often overreact-in predictable ways. Take the guesswork out of growing your portfolio by staying ahead of those reactions, where you can both profit and protect your assets with Technical Analysis Explained, Fifth Edition.Table of Contents:Part I: Trend-Determining Techniques The Definition and Interaction of Trends Financial Markets and the Business Cycle Dow Theory Typical Parameters for Intermediate Trends How to Identify Support and Resistance Zones Trendlines Basic Characteristics of Volume Classic Price Patterns Smaller Price Patterns and Gaps One- and Two-Bar Price Patterns Moving Averages Envelopes and Bollinger Bands Momentum I: Basic Principles Momentum II: Individual Indicators Momentum III: Individual Indicators Candlestick Charting Point and Figure Charting Miscellaneous Techniques for Determining Trends The Concept of Relative Strength Putting the Indicators Together: The DJ Transports Part II: Market Structure Price: The Major Averages Price: Sector Rotation Time: Analyzing Secular Trends for Stocks, Bonds and Commodities Time: Cycles and Seasonal Patterns Practical Identification of Cycles Volume II: Volume Indicators Market Breadth Part III: Other Aspects of Market Analysis Indicators and Relationships That Measure Confidence The Importance of Sentiment Integrating Contrary Opinion and Technical Analysis Why Interest Rates Affect the Stock Market Using Technical Analysis to Select Individual Stocks Technical Analysis of International Stock Markets Automated Trading Systems Checkpoints for Identifying Primary Stock Market Peaks and Troughs Epilogue Appendix: The Elliott Wave Glossary Bibliography Index
INTRODUCTION TECHNICAL ANALYSIS
This new edition of Introduction to Technical Analysis explains how to evaluate trends, highs, lows, price/column relationships, price patterns, moving averages and momentum indicators for a contemporary audience, using fully new, updated charts, diagrams and examples. Pring uses his trademark expertise and engaging writing style to simplify concepts for traders. Links to an exclusive downloadable video featuring original content and in-depth explanations of the material is also included. Salient features: • Research and construct instantly valuable charts of stock and market activity • Interpret the basic concepts of momentum and apply the theory to actual trades through a common sense set of trading strategies • Use price and volume pattern to identify breakouts • Analyze and act on peaks and troughs that can signal a change in the prevailing trend • Calculate moving averages and gauge their impact
📚 Important Note on Book Condition:
This is a pre-owned/used book. While all pages are intact and perfectly readable, the book may show signs of wear such as:
1) Minor creases or bends, 2) Slight yellowing of pages, 3) Faint markings or name written inside
We ensure good, readable condition for every book we sell.
If you're looking for new or pristine condition, please check our listings marked as "New."


